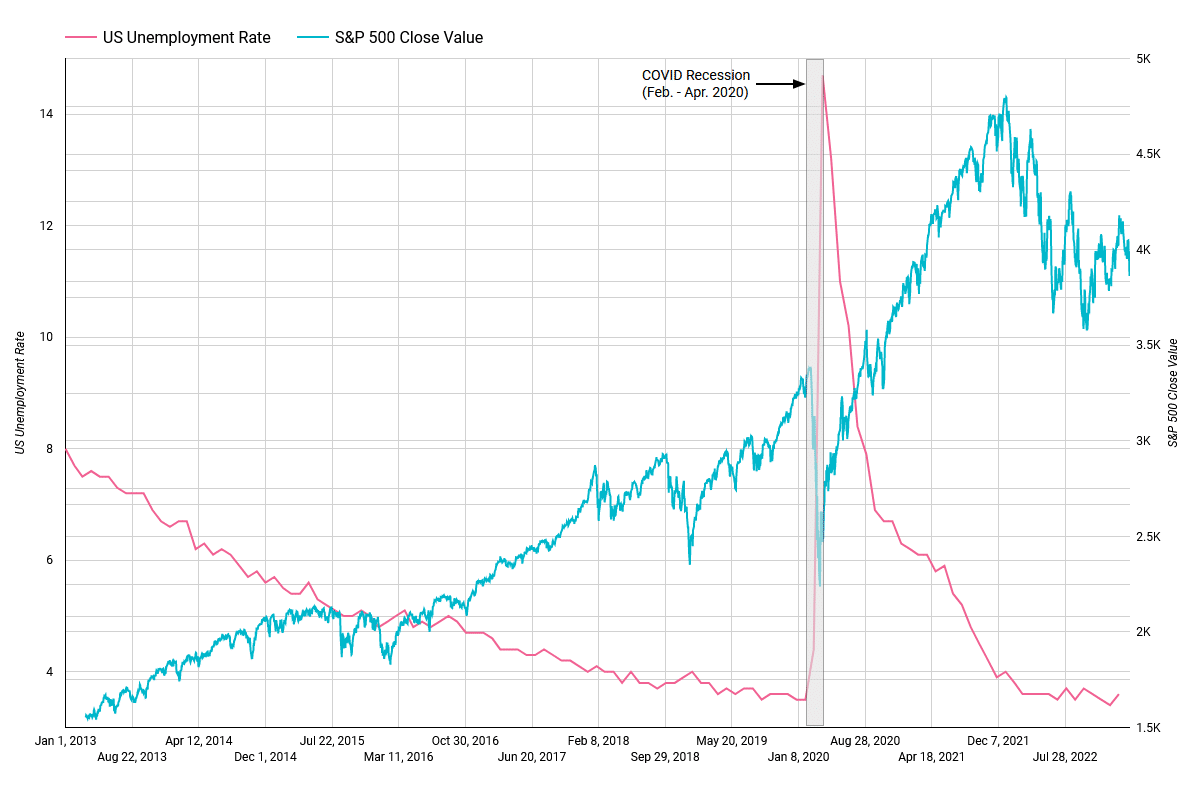
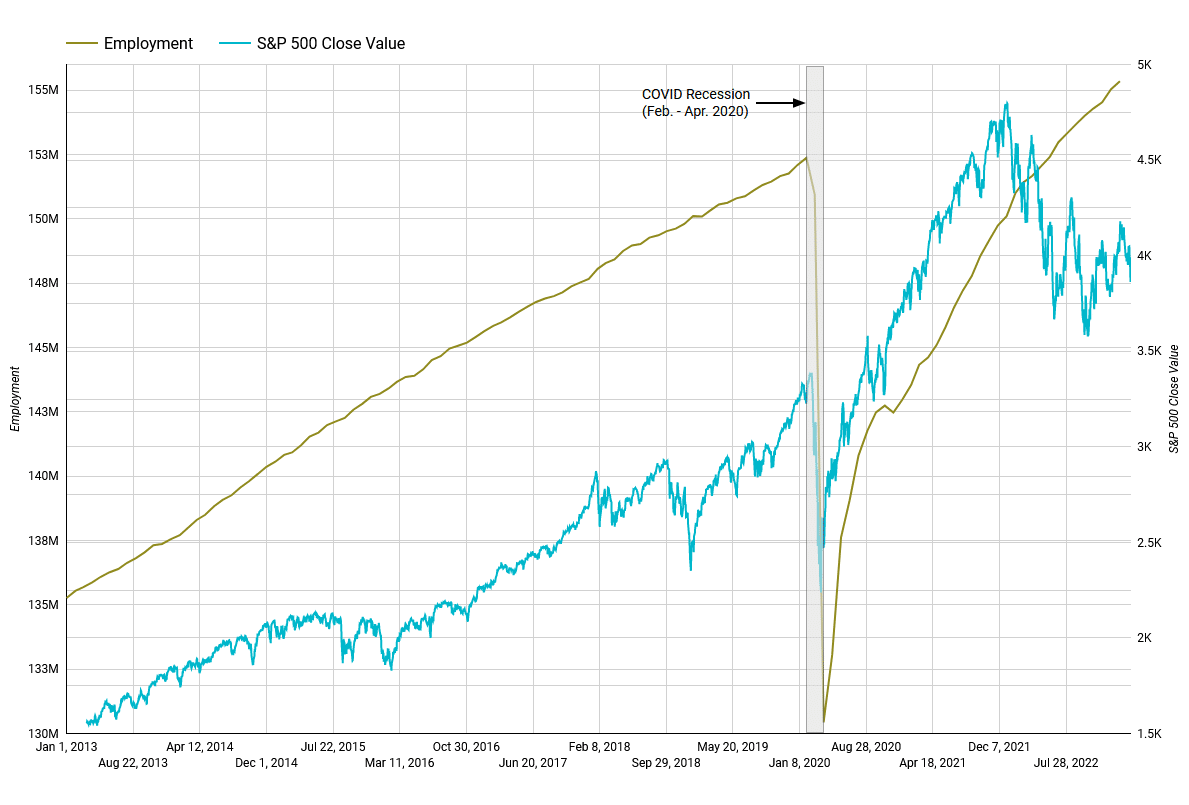
Above are the 10-year charts for the S&P 500 daily close value, the US unemployment rate, and employment monthly values (the charts are clickable). The time spans from March 2013 to March 2023 for the S&P graph and from January 2013 to February 2023 for the unemployment rate and employment graphs. The S&P 500 data comes from Nasdaq, and the unemployment rate and employment data comes from the US Bureau of Labor Statistics.
The S&P 500 index tracks the prices of stocks for the 500 US-listed companies with the highest market capitalization, the unemployment rate is the percentage of employable people not having a job, and the employment is the number of people with a job.