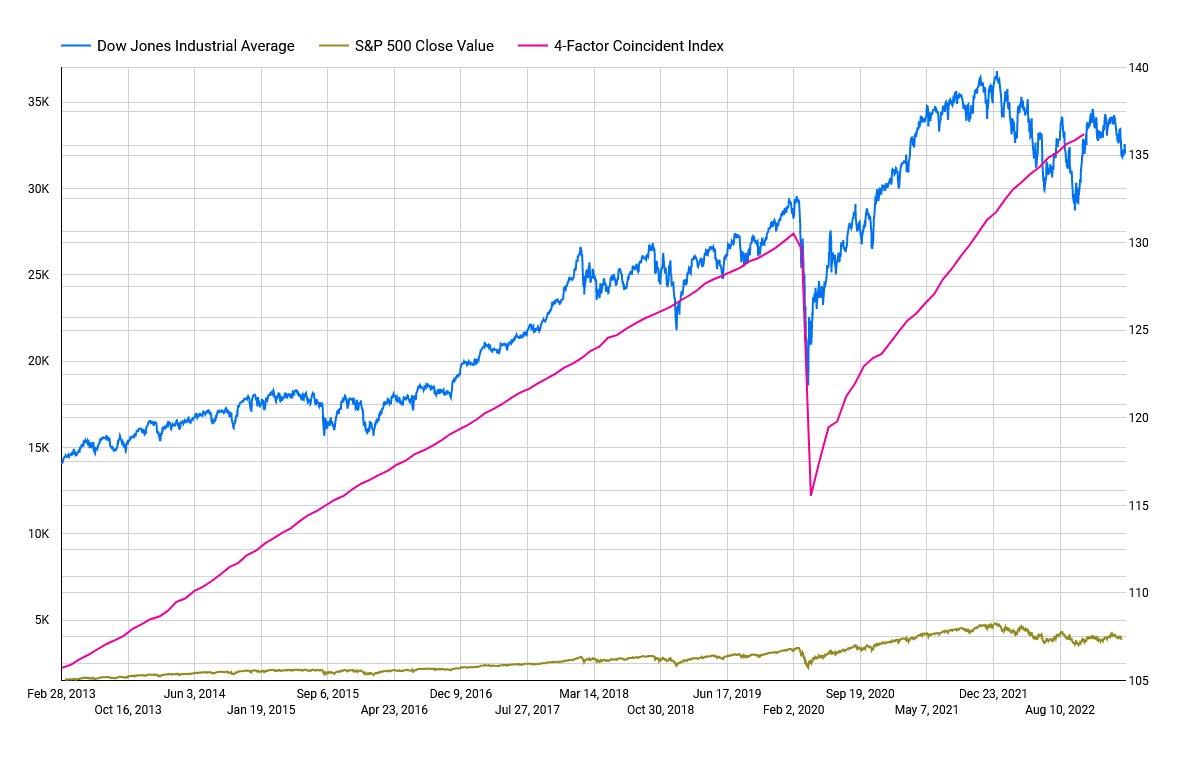
Above is the 10-year chart for the Dow Jones Industrial Average daily value, S&P 500 daily close value, and 4-factor coincident index monthly value (the chart is clickable). The time spans from February 2013 to March 2023 for the Dow Jones, March 2013 to March 2023 for the S&P 500 graph, and from March 2013 to November 2022 for the 4-factor coincident index. The Dow Jones Industrial Average data comes from the S&P Dow Jones Indices, the S&P 500 data comes from Nasdaq, and the 4-factor coincident index data comes from FRED Economic Data.
The Dow Jones Industrial Average tracks the prices of stocks for the 30 US-listed largest companies by market capitalization, the S&P 500 index tracks the prices of stocks for the 500 US-listed companies with the highest market capitalization, while the 4-factor coincident index includes four indicators: nonfarm payroll employment, the unemployment rate, average hours worked in manufacturing and wages and salaries. A drop in the value of the 4-factor coincident index marks a recessionary period.