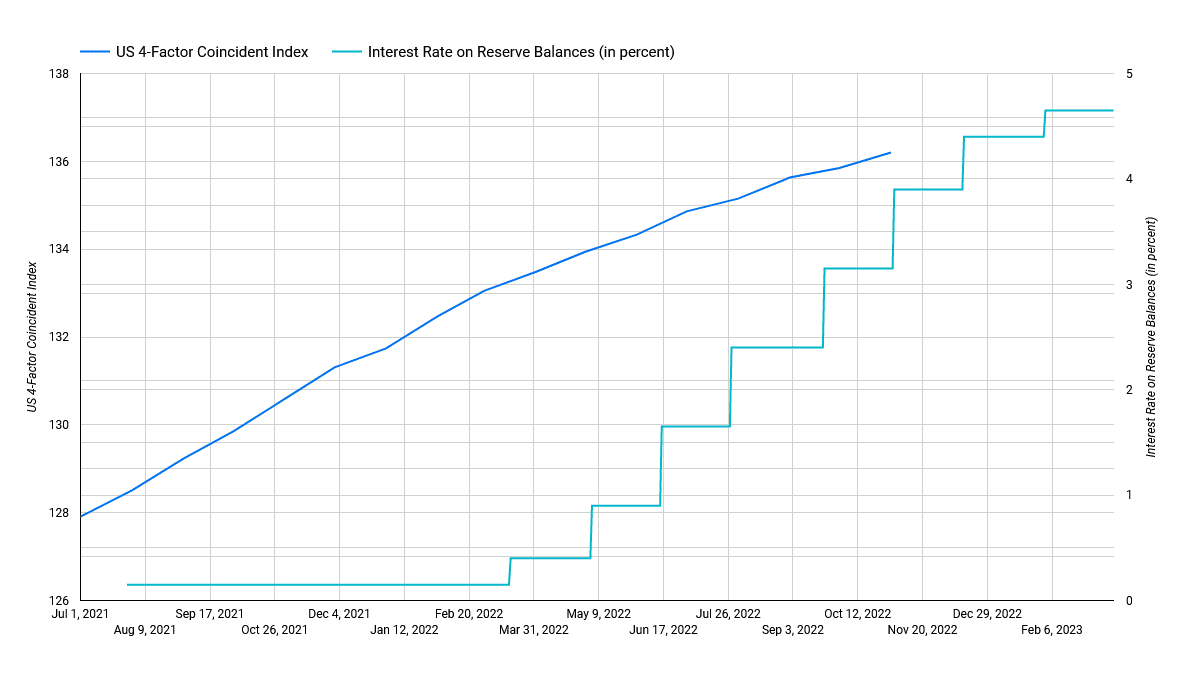
Above is the historical Federal Reserve interest rate chart with the 4-factor coincident index monthly value (the chart is clickable). The time spans from July 2021 to March 2023 for the federal reserve interest rate graph and from July 2021 to November 2022 for the 4-factor coincident index. Both the Fed interest rate and the 4-factor coincident index data come from FRED Economic Data.
The interest rate on reserve balances is the interest the Federal Reserve pays to banks that deposit money to its central bank, while the 4-factor coincident index includes four indicators: nonfarm payroll employment, the unemployment rate, average hours worked in manufacturing and wages and salaries. A drop in the value of the 4-factor coincident index marks a recessionary period.