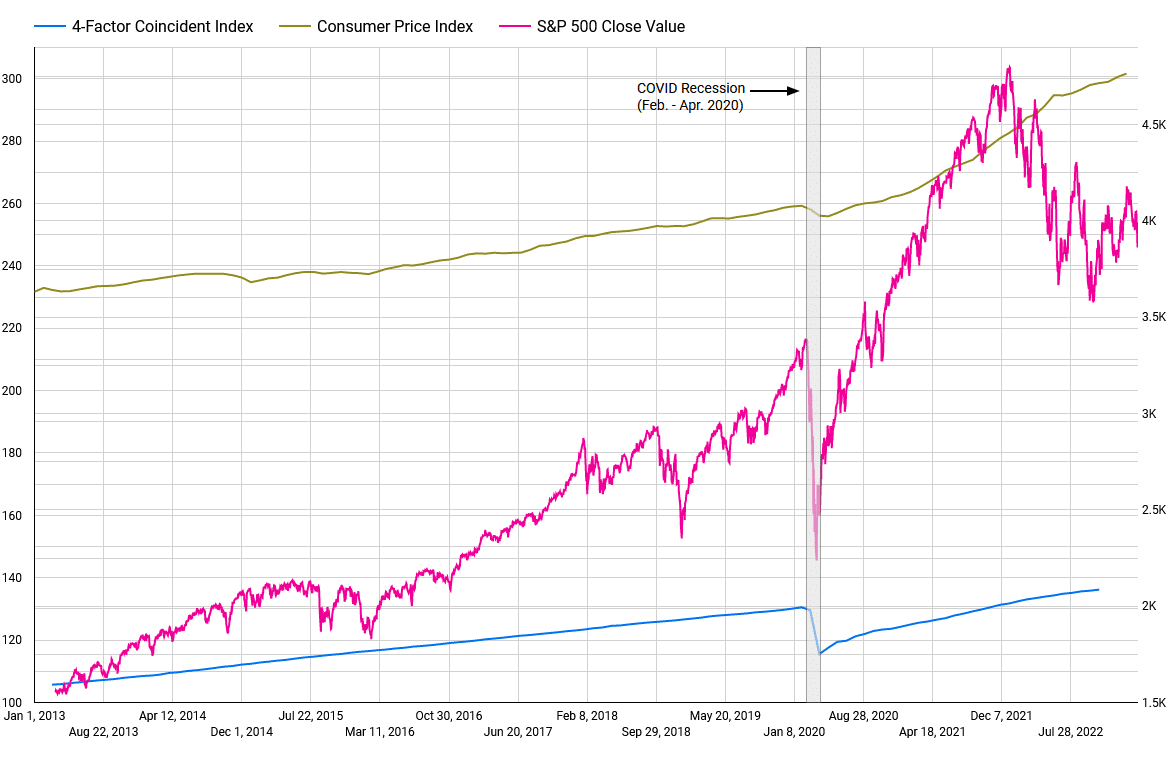
Above is the 10-year chart for the consumer price index monthly value, S&P 500 daily close value, and 4-factor coincident index monthly value (the chart is clickable). The time spans from January 2013 to February 2023 for the consumer price index, March 2013 to March 2023 for the S&P 500 graph, and from March 2013 to November 2022 for the 4-factor coincident index. The consumer price index data comes from U.S. Bureau of Labor Statistics, the S&P 500 data comes from Nasdaq, and the 4-factor coincident index data comes from FRED Economic Data.
The consumer price index tracks changes in the prices paid by urban consumers for some quantity of goods and services; the trend of the consumer price index (upward, stagnant, or upward) can be used to conclude if the prices of goods have risen (inflation) or dropped (deflation). The S&P 500 index tracks the prices of stocks for the 500 US-listed companies with the highest market capitalization, while the 4-factor coincident index includes four indicators: nonfarm payroll employment, the unemployment rate, average hours worked in manufacturing and wages and salaries. A drop in the value of the 4-factor coincident index marks a recessionary period.