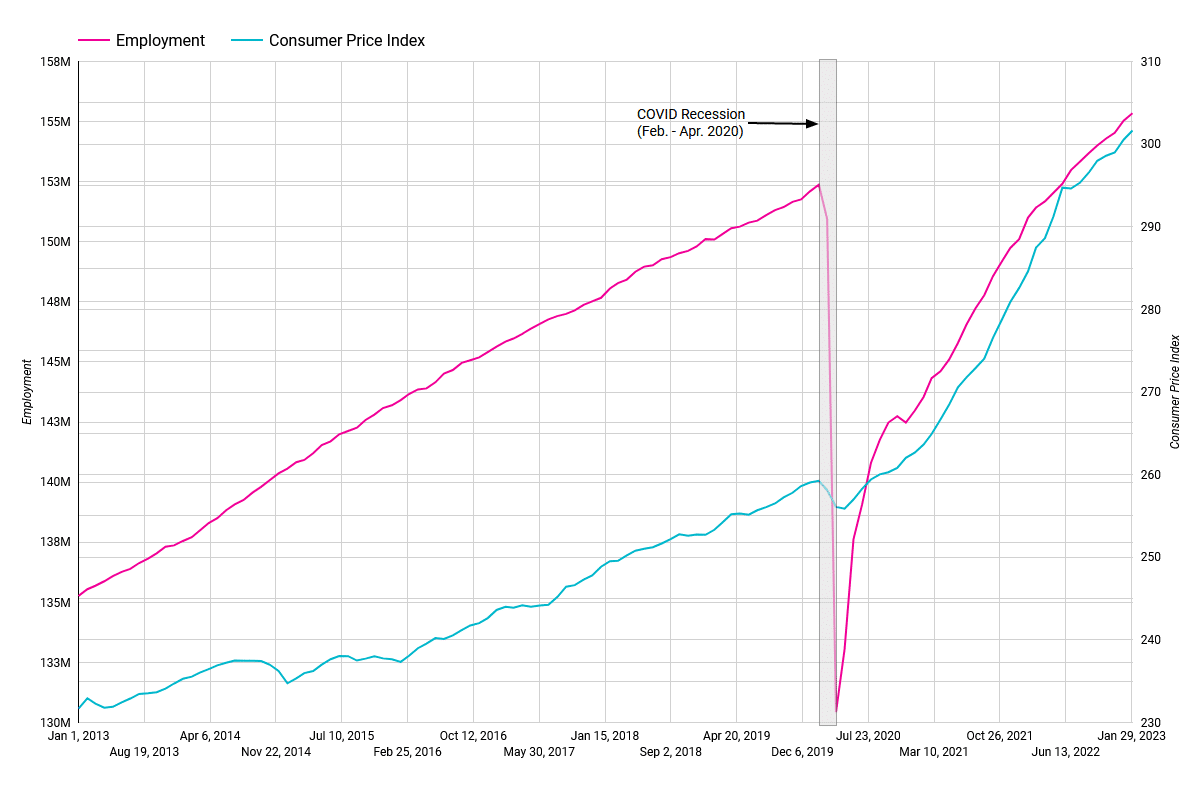
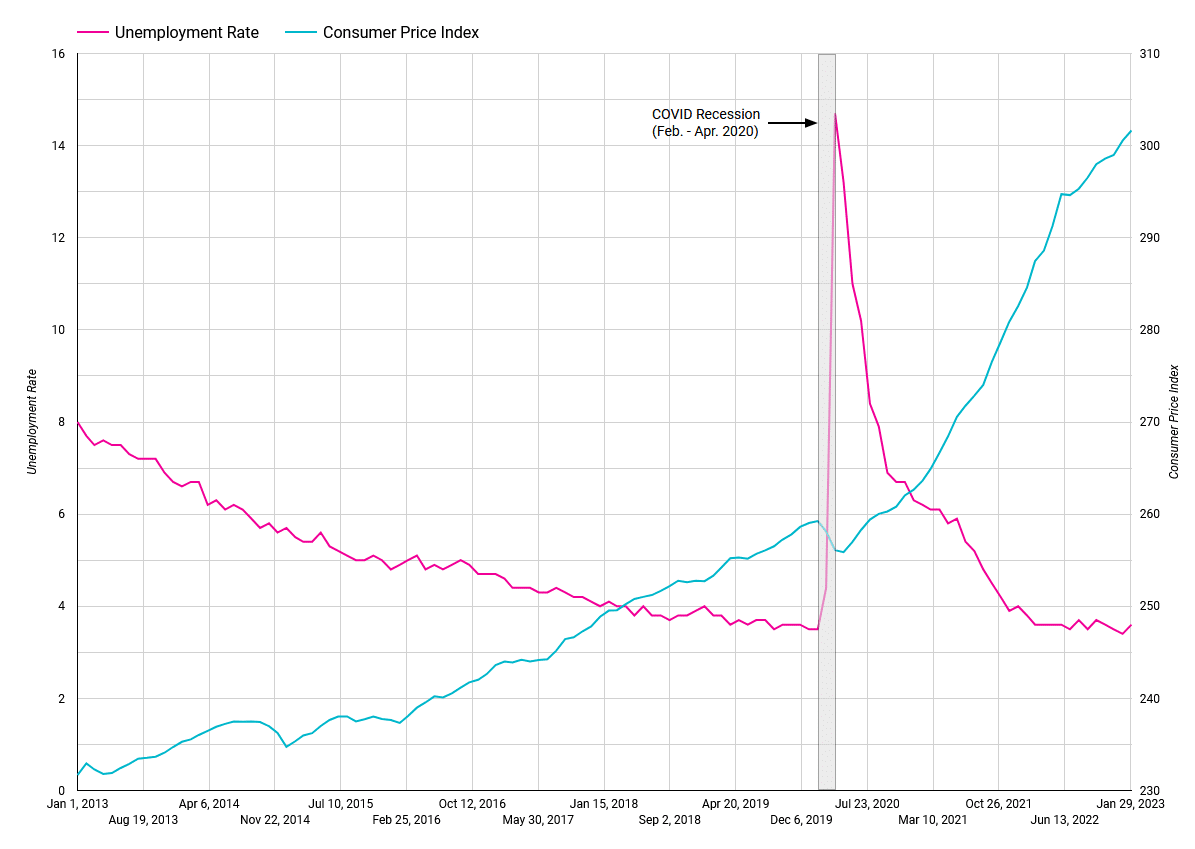
Above are the 10-year charts for the consumer price index monthly value, the monthly employment number, and the monthly unemployment rate (the charts are clickable). The time spans from January 2013 to February 2023 for the consumer price index, and from January 2013 to February 2023 for the unemployment rate and employment graphs . The consumer price index, the unemployment rate, and employment data comes from U.S. Bureau of Labor Statistics.
The consumer price index tracks changes in the prices paid by urban consumers for some quantity of goods and services; the trend of the consumer price index (upward, stagnant, or upward) can be used to conclude if the prices of goods have risen (inflation) or dropped (deflation). The unemployment rate is the percentage of employable people not having a job, and the employment is the number of people with a job.