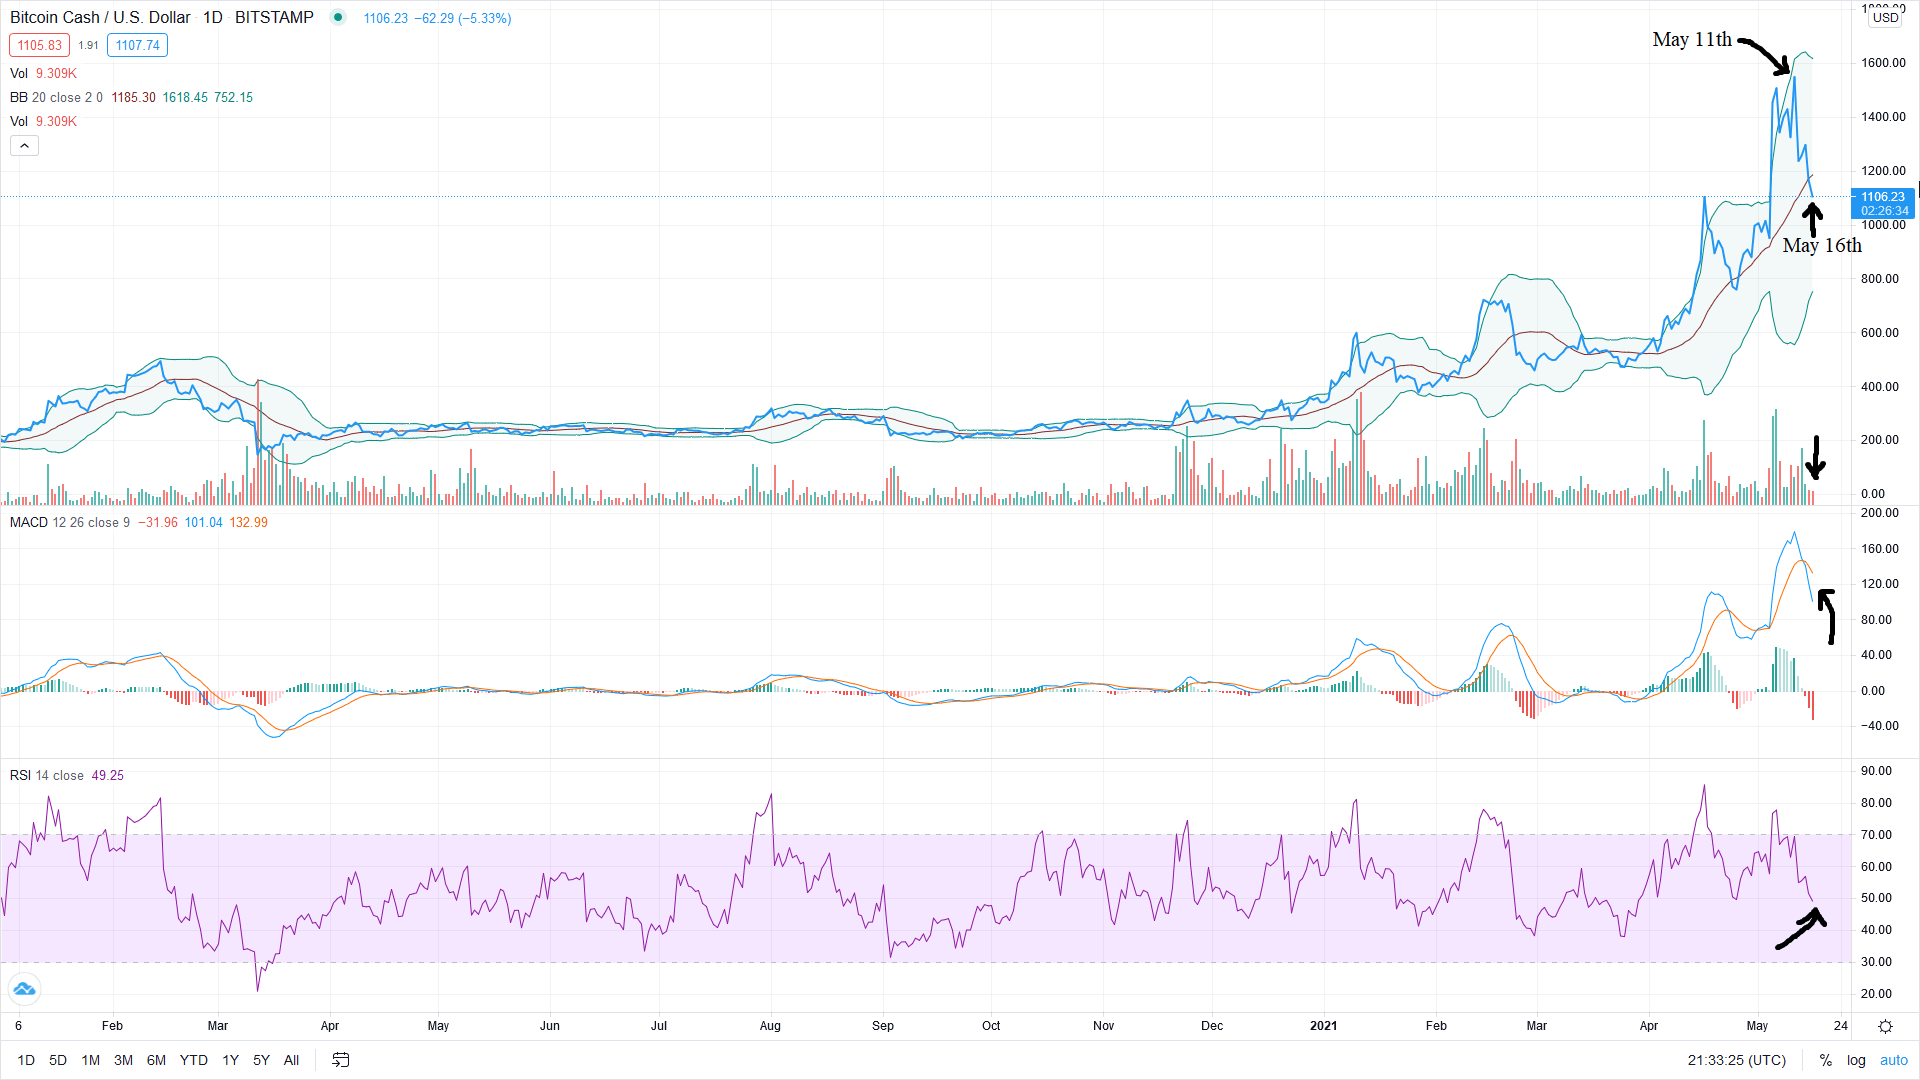
Roughly, when the price rises, so does the RSI, and it goes down when the price drops (see image). When the value of the RSI nears 30, the price tends to cross, touch, or near the lower band, and when the value of the RSI nears 70, the price tends to cross, touch, or near the upper band. When the price crosses the upper Bollinger band and stays above it for some time and the upper and lower Bollinger bands are wider apart, the RSI stays above the 70 line for some time (see image). The trend of the RSI graph tends to coincide with the trend of the midline of the Bollinger Bands.